60 years at AccuWeather and 25 for me
As I begin my 25th year working at AccuWeather. It's also AccuWeather's 60th anniversary. Let's talk about graphics changes over the years.
This year (on August 3, 2022) I began my 25th year working at AccuWeather. It's also AccuWeather's 60th anniversary (see our 60th Anniversary news story, corporate site and an interactive company timeline).
I’m a meteorologist by training, but during my time here, I have worn many hats, as they say. I’ve done web design, programming, writing, editing, graphics creation, blogging, subscription services management, community management and social media.
Today, I’d like to talk about weather graphics, specifically weather maps, which have been an ongoing theme throughout all my years here. Compelling multimedia has always been a huge part of AccuWeather’s business.
When I started working at AccuWeather in 1997, we were starting to move TV clients, AccuData (weather-by-modem) clients and early web clients from 4-bit 16-color graphics to 8-bit 256-color maps. The pixel size (on a computer screen) jumped from 380x240 to 768x512. These graphics carried us through the 2000s, and we upgraded the look of the graphics in 2003 when we could do 32-bit graphics (with millions of colors).

The evolution of AccuWeather’s weather maps 1998-2018 (click to enlarge)
In 2012, we went to “HD” 1920x1080 size graphics, and then we did another redesign to them in 2015. In 2018, we added HD graphics from our AccuWeather TV Network to the stories as well. Above is a comparison of what the different sizes look like; click to enlarge it. Quite an improvement over 30 years!
In 1974 (the year I was born!), AccuWeather sold weather maps the only way they could, via fax. In 1983, we offered ready-for-air television graphics, which were transmitted via satellite to tv stations in 1986, and new modem services like Compuserve and AOL beginning in 1990. By 1993, you could dial into AccuWeather’s modem bank and download weather maps and information through a service called AccuData. This “sizzle reel” from 1988 showcases our wares at the time:
You’ll notice in that video that we had automated maps showing radar and satellite data, but the crucial differentiator was our hand-drawn graphics. At that time, maps showing complex weather variables (fronts, pressure systems and jet streams) couldn’t be automated. We had a team of meteorologists who would draw the maps by hand on paper and give them to a graphic designer, who would turn them into full-color graphics with Photoshop. This was a luxury most weather companies couldn’t afford, and it continues to be one of our “value-added” products to this day.
In 1995, I graduated with a B.S. in Meteorology from the University of North Carolina at Asheville. The mid-1990s, of course, was the beginning of the Internet era, specifically the World Wide Web.
They didn’t teach HTML in universities then, but I learned how to write HTML and do UNIX system administration on the side while I was in school. After I graduated, the job market in meteorology was very tight because of a government hiring freeze. While working for a startup Internet Service Provider in Raleigh, N.C., I applied to AccuWeather to become a forecaster, but they ended up hiring me to help with their fledgling Internet department.

AccuWeather.com's web page in 1998
Over the years, I’ve been fortunate to be able to create new positions for myself, again and again, that were on the cutting edge of AccuWeather’s internet efforts. I've written, edited, produced graphics and videos, managed subscription services and online communities for the company. (This blog, in fact has been running since 2005 when I became AccuWeather's first weather blogger). Last year, I moved from my 10-year Social Media Manager position at AccuWeather to a position as Senior Weather Editor.
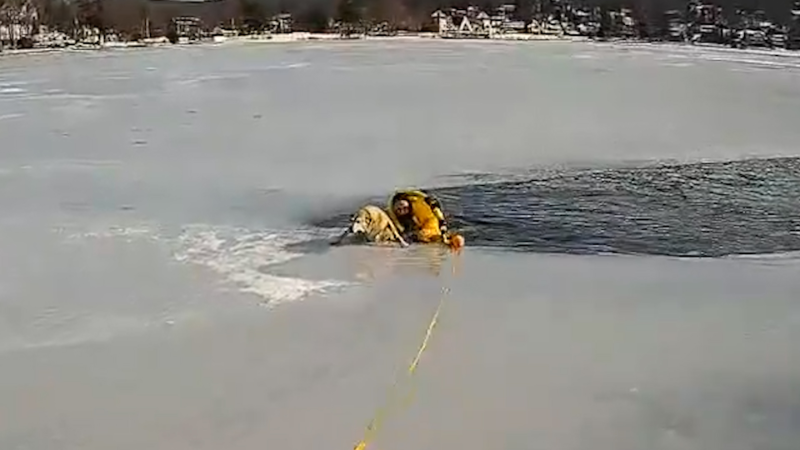
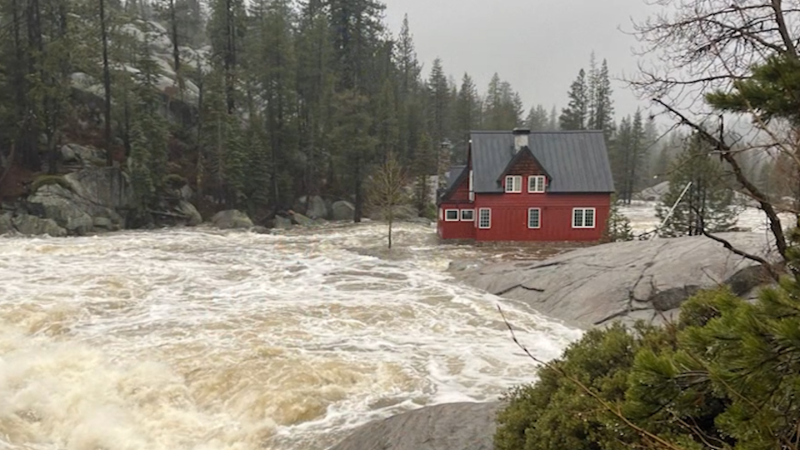
Through this new position, I write and edit AccuWeather.com news stories (which also go to the AccuWeather app). I also research weather data that can give our weather stories a unique spin, quantifying the weather for our users. Another thing I do is recommend or create maps, graphs and visualizations for AccuWeather.com stories, which will continue to be crucial to the success of our editorial team, and I’m proud to be part of it.
See you back here in another 25 years!