Snow Problem! Pennsylvania Gets Updated Maps
When Henry and I attended the "Winter Media Day" conference at the Central Pennsylvania National Weather Service office last week, one subject that came up was the antiquated "Average Annual Snowfall Map" which is shown below (and looks to me to be a hand drawn map for WeatherWorld at PSU, probably hand-drawn 15-25 years ago):
Let's just say a lot has changed since then. The latest climate data set uses the 1981-2010 30-year normals, and as of today this new map is now available on their website. There are a couple of major differences. First, the snow in the lee of Lake Erie has been smoothed out (this makes more sense than the weird contours on the old map -- lake-effect distribution should be smoother and areas close to the lake should get the most). Next, an anomalously large area in Clearfield county (with no meteorological explanation that I can think of) was removed.
And last but not least, the snow has been increased in southwest Cambria County, one of my pet peeves. The old map really looked like the one data point at Seven Springs or Hidden Valley Ski Resort was used, while in reality the mountains to their northeast see comparable heavy upslope and lake-effect snows (see photo from "Stormchaser Ron" below). He gets over 100 inches in a slow winter, and the numbers may still be too low there, but you can only work from the data points you have.

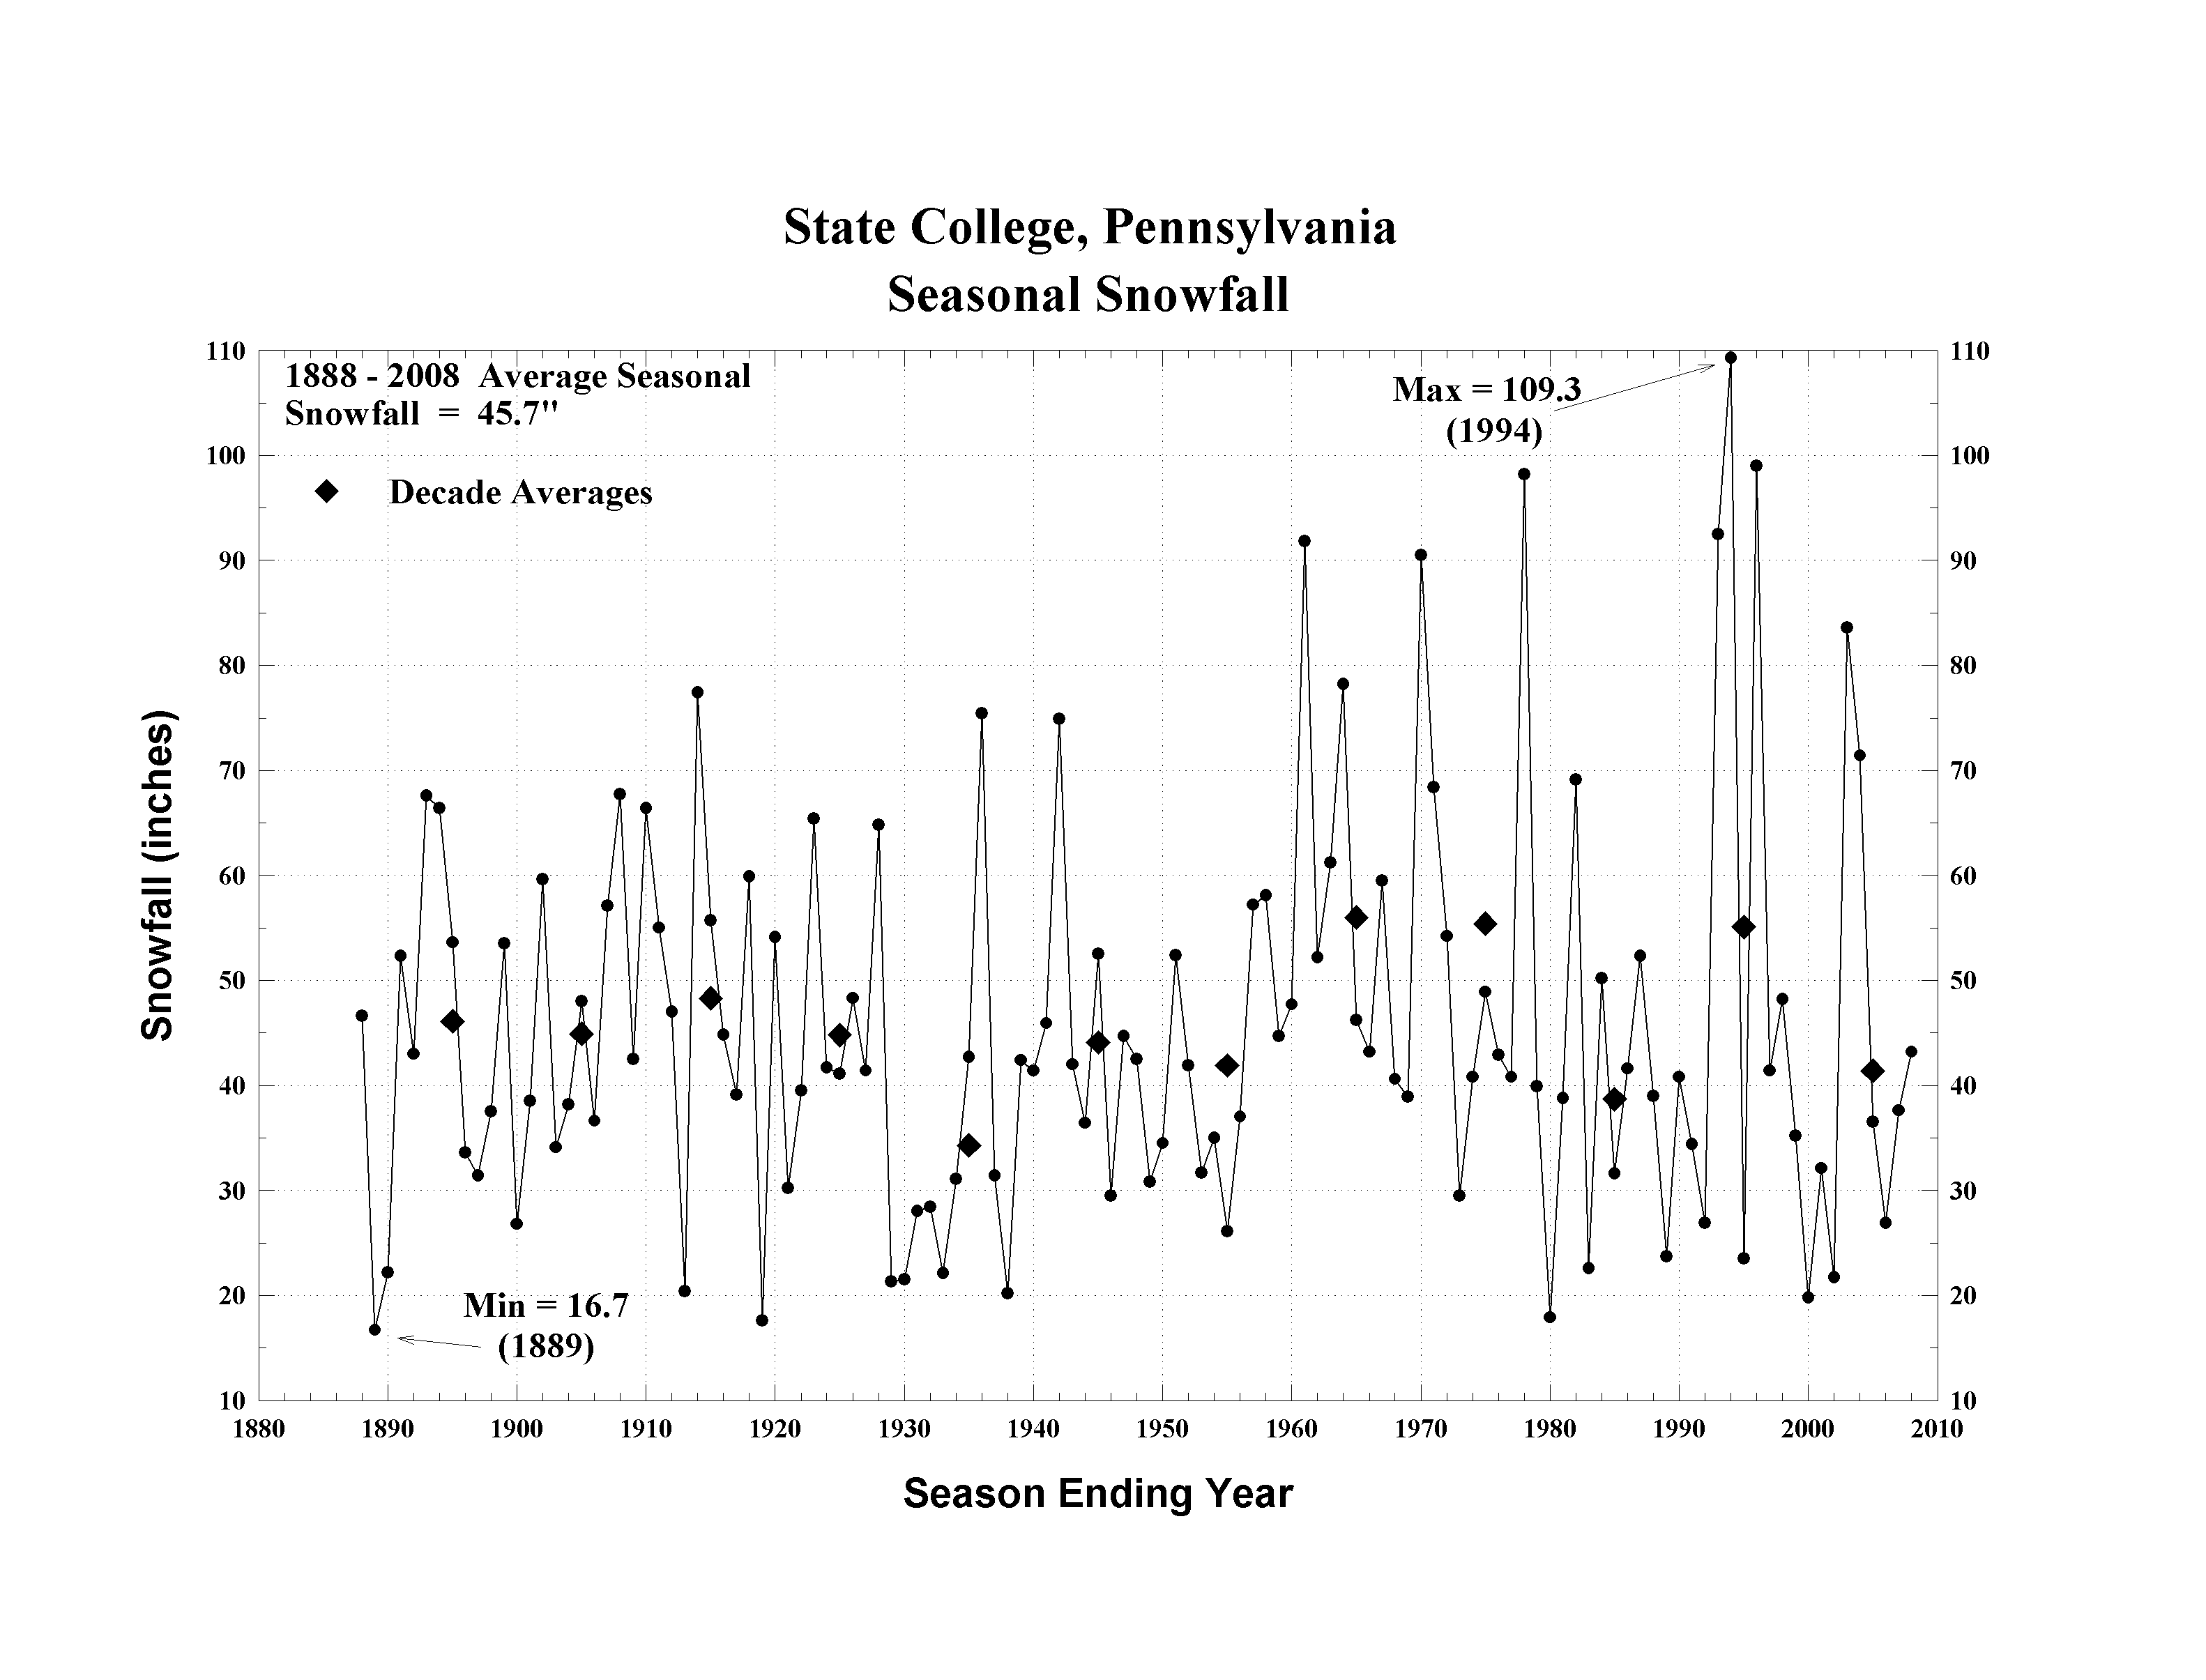
The NWS office will be releasing a map showing the changes from 1971-2000 and 1981-2010, which will be very interesting to see. Since I have lived here in State College, we have had at or below-normal snowfall for 87.5% (14 out of 16) winter seasons since 1997. From that, one would think that our average annual total would be much smaller than it used to be. However, the mid-1990s included several blockbuster years, so (according to the map above) we're still at around 46 inches. The craziest thing is that most of that comes in small snowfalls that add up. I've only experienced around three storms that dropped more than a foot. Clearly I am causing a snow drought - here's the sad graph (from PSU data):
Report a Typo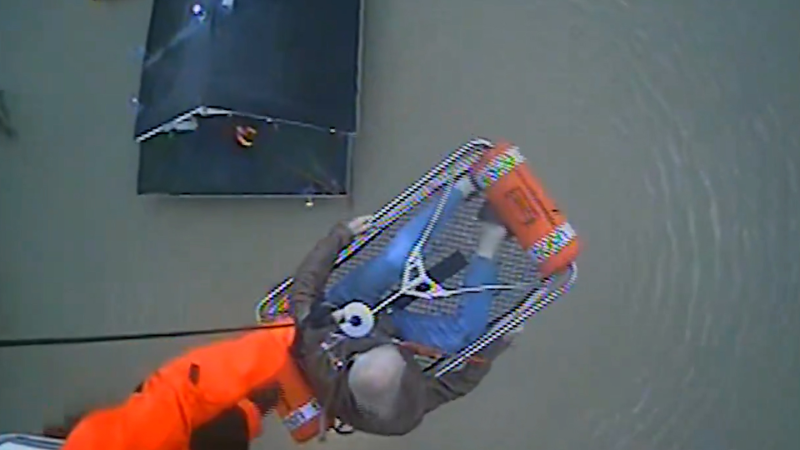


